

Statistics & history
CountTally logs every change with a timestamp. From that come charts, a heatmap calendar and a detailed history – for individual counters, groups or tags.
Statistics & charts
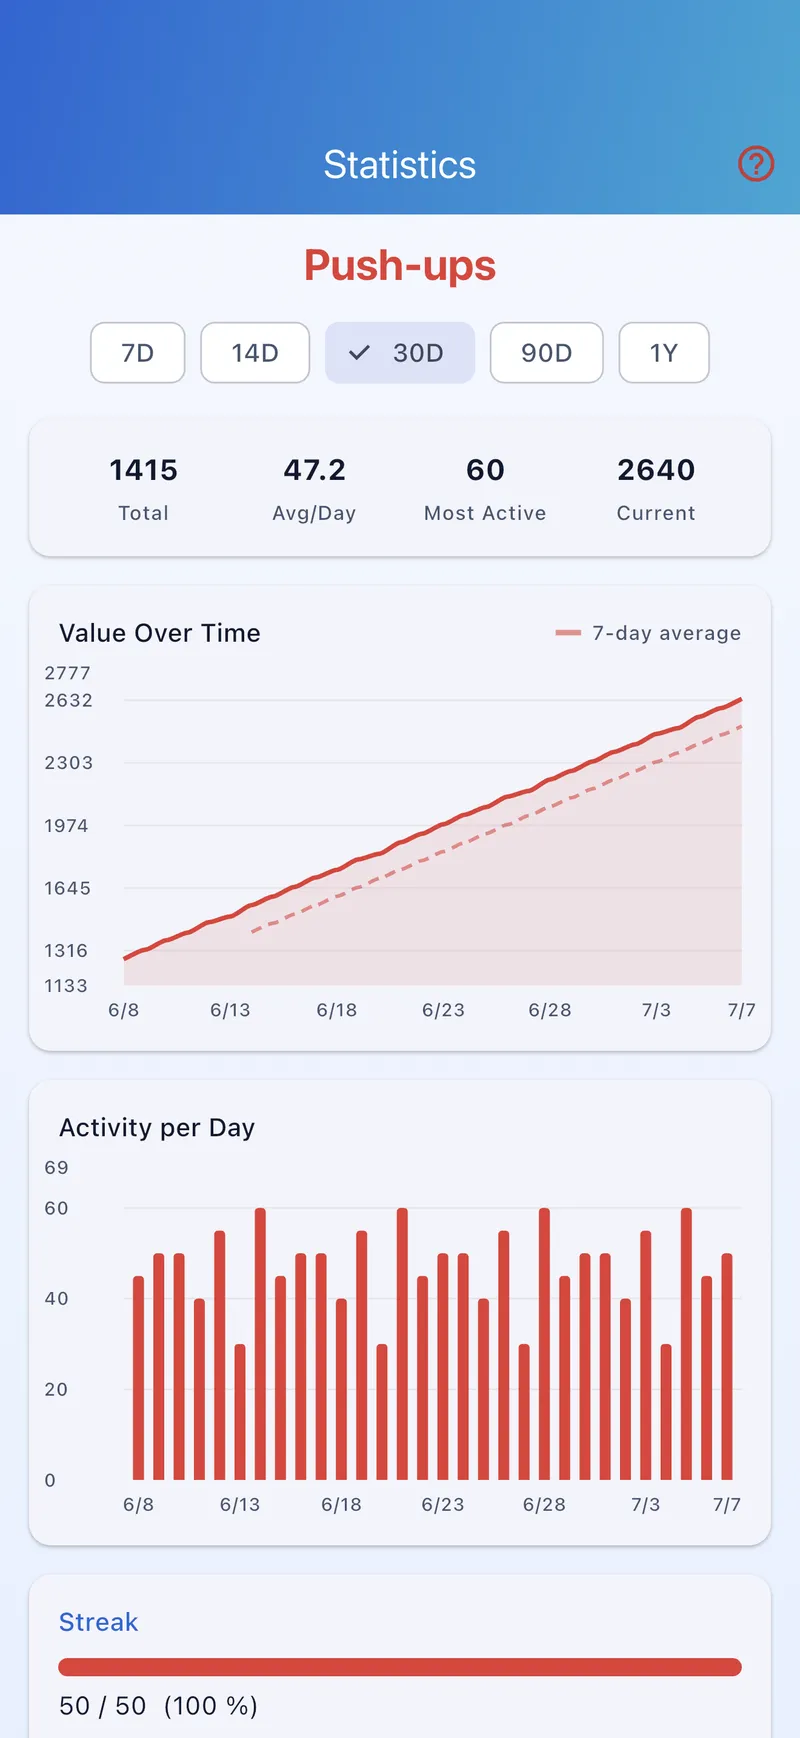
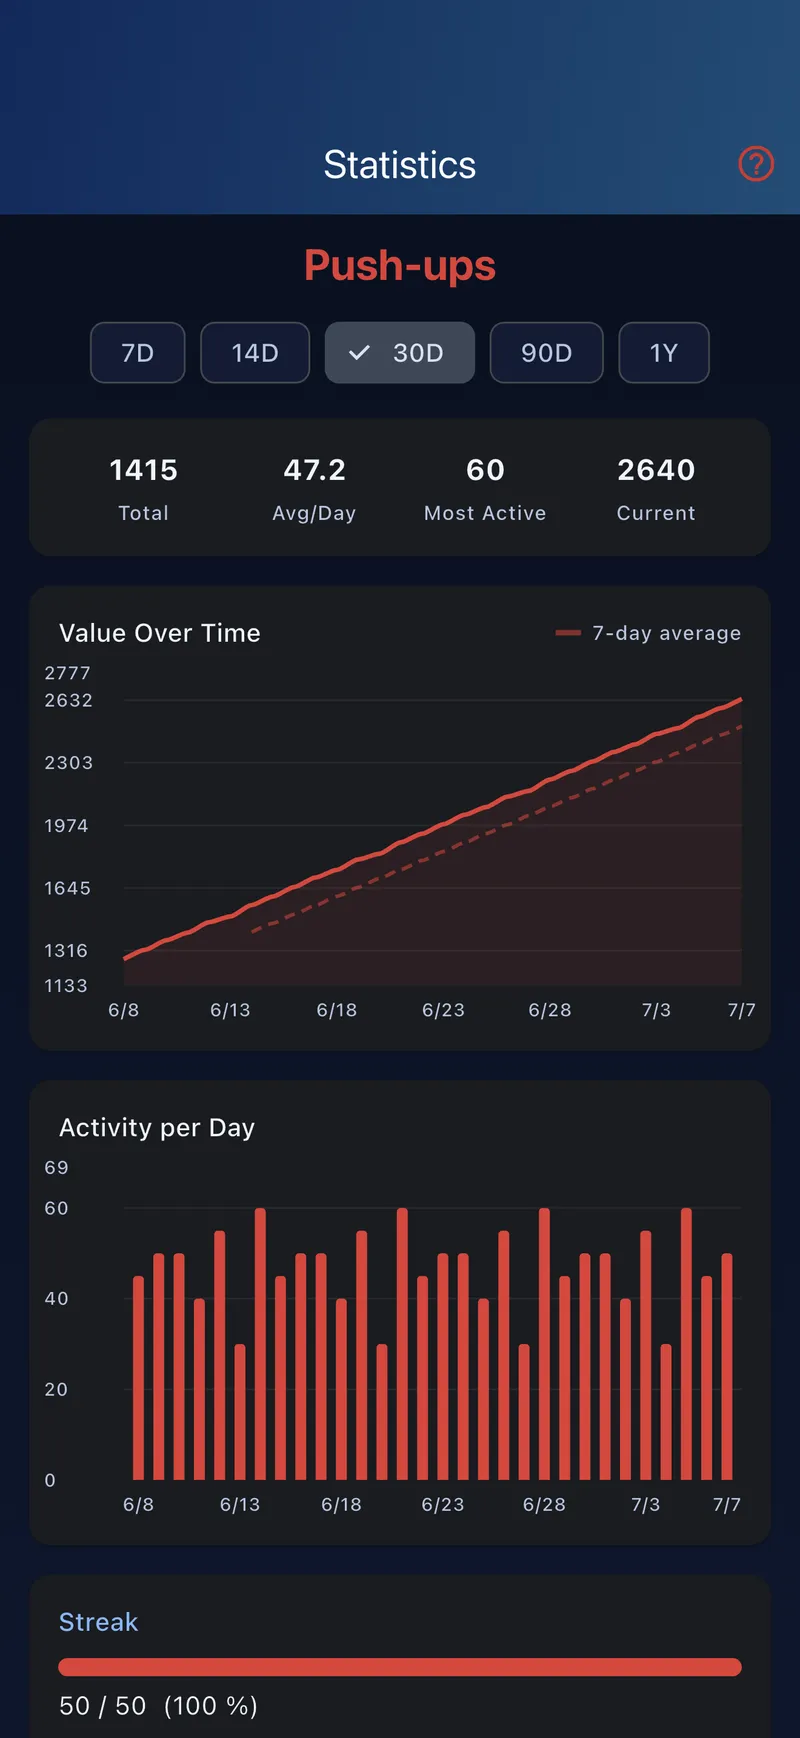
Open the statistics view via a counter's chart icon (or for a group or a tag). You'll see:
- Time range selector – day, week, month, year.
- Summary cards – total, average and other figures for the selected range.
- Value over time – how the counter developed (line chart).
- Activity – how much was counted per day/week (bar chart).
Basic statistics are always free. Full statistics with all charts are available from Lifetime.
Heatmap calendar
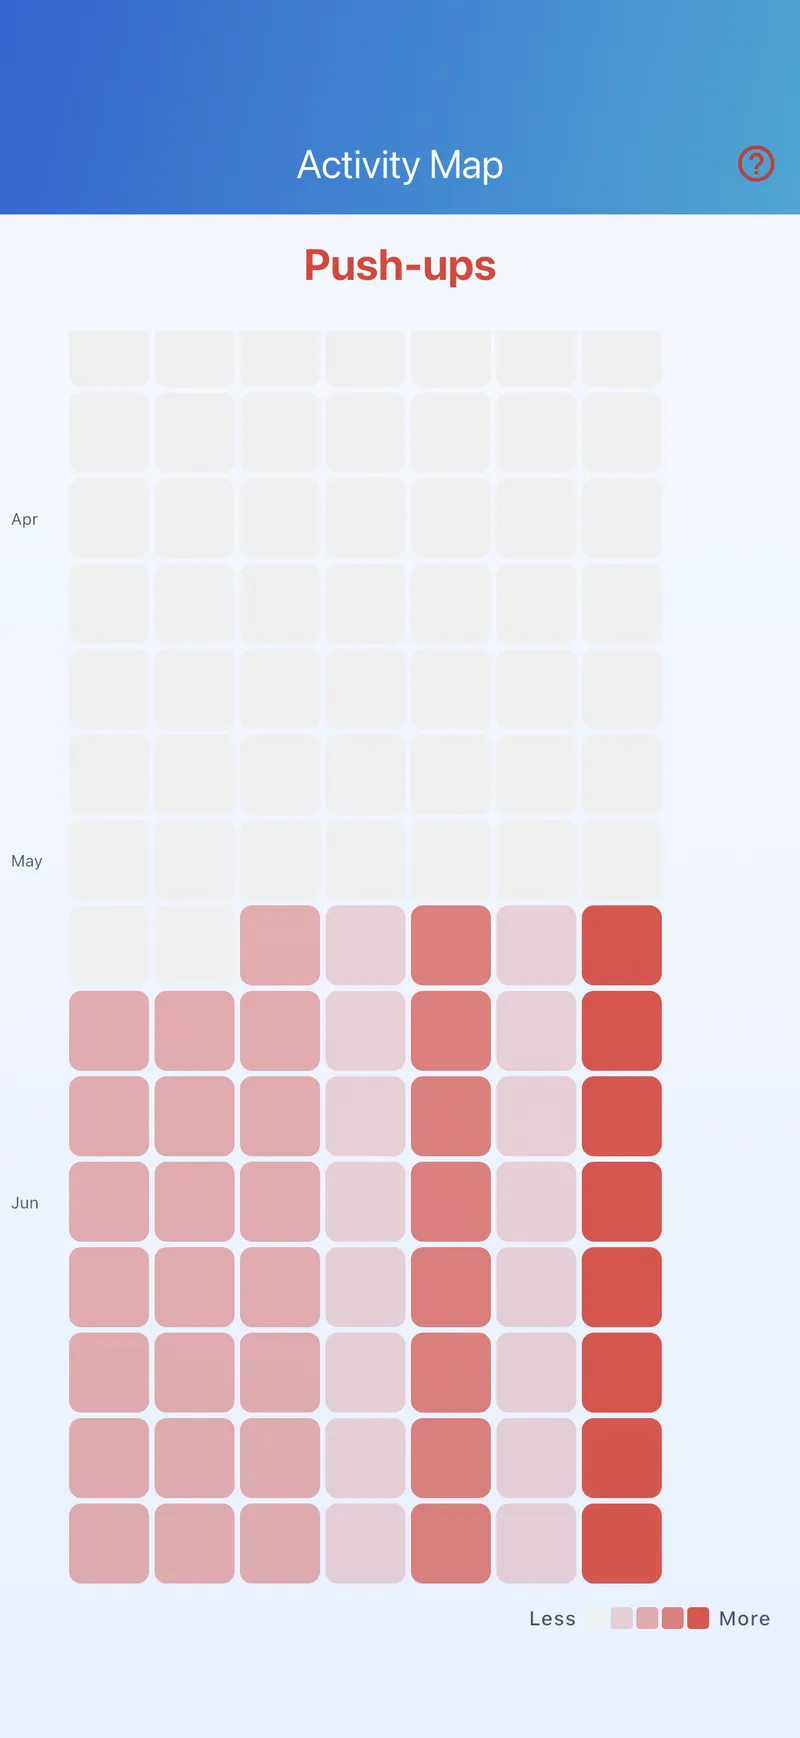
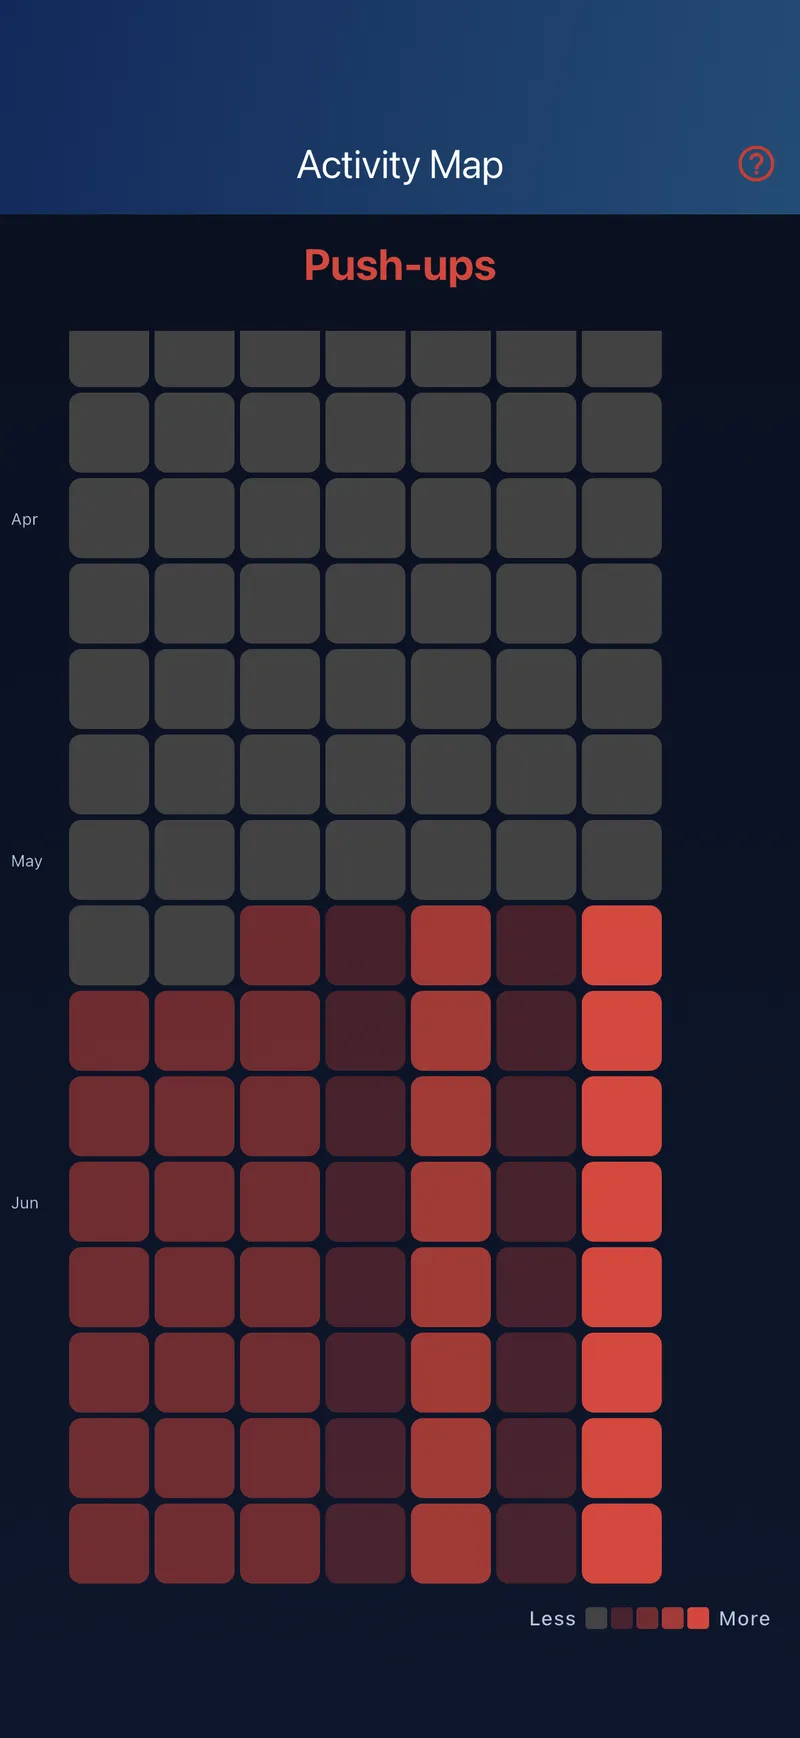
The heatmap shows your “counting year” as an activity calendar: each day is a cell, coloured more strongly the more you counted that day – so you spot patterns and streaks at a glance. Open it for a counter or a tag.
History
The history lists every counting action grouped by day – with timestamps. So you can trace when each value was recorded. With active sessions, the history is neatly grouped per session.
Statistics look-back per plan
How far back you can analyse depends on your plan (ongoing counting is unaffected):
| Plan | Look-back |
|---|---|
| Free | 14 days |
| Lifetime | 30 days |
| Pro | 90 days |
| Premium | 365 days |
More about the plans on the pricing page.